Understanding Evolution Results
After an evolution completes, Kai presents a detailed breakdown of what was discovered, how solutions improved over time, and which programs performed best.
Evolution Detail Page
Click on any completed evolution from the repository detail page to open its full results.
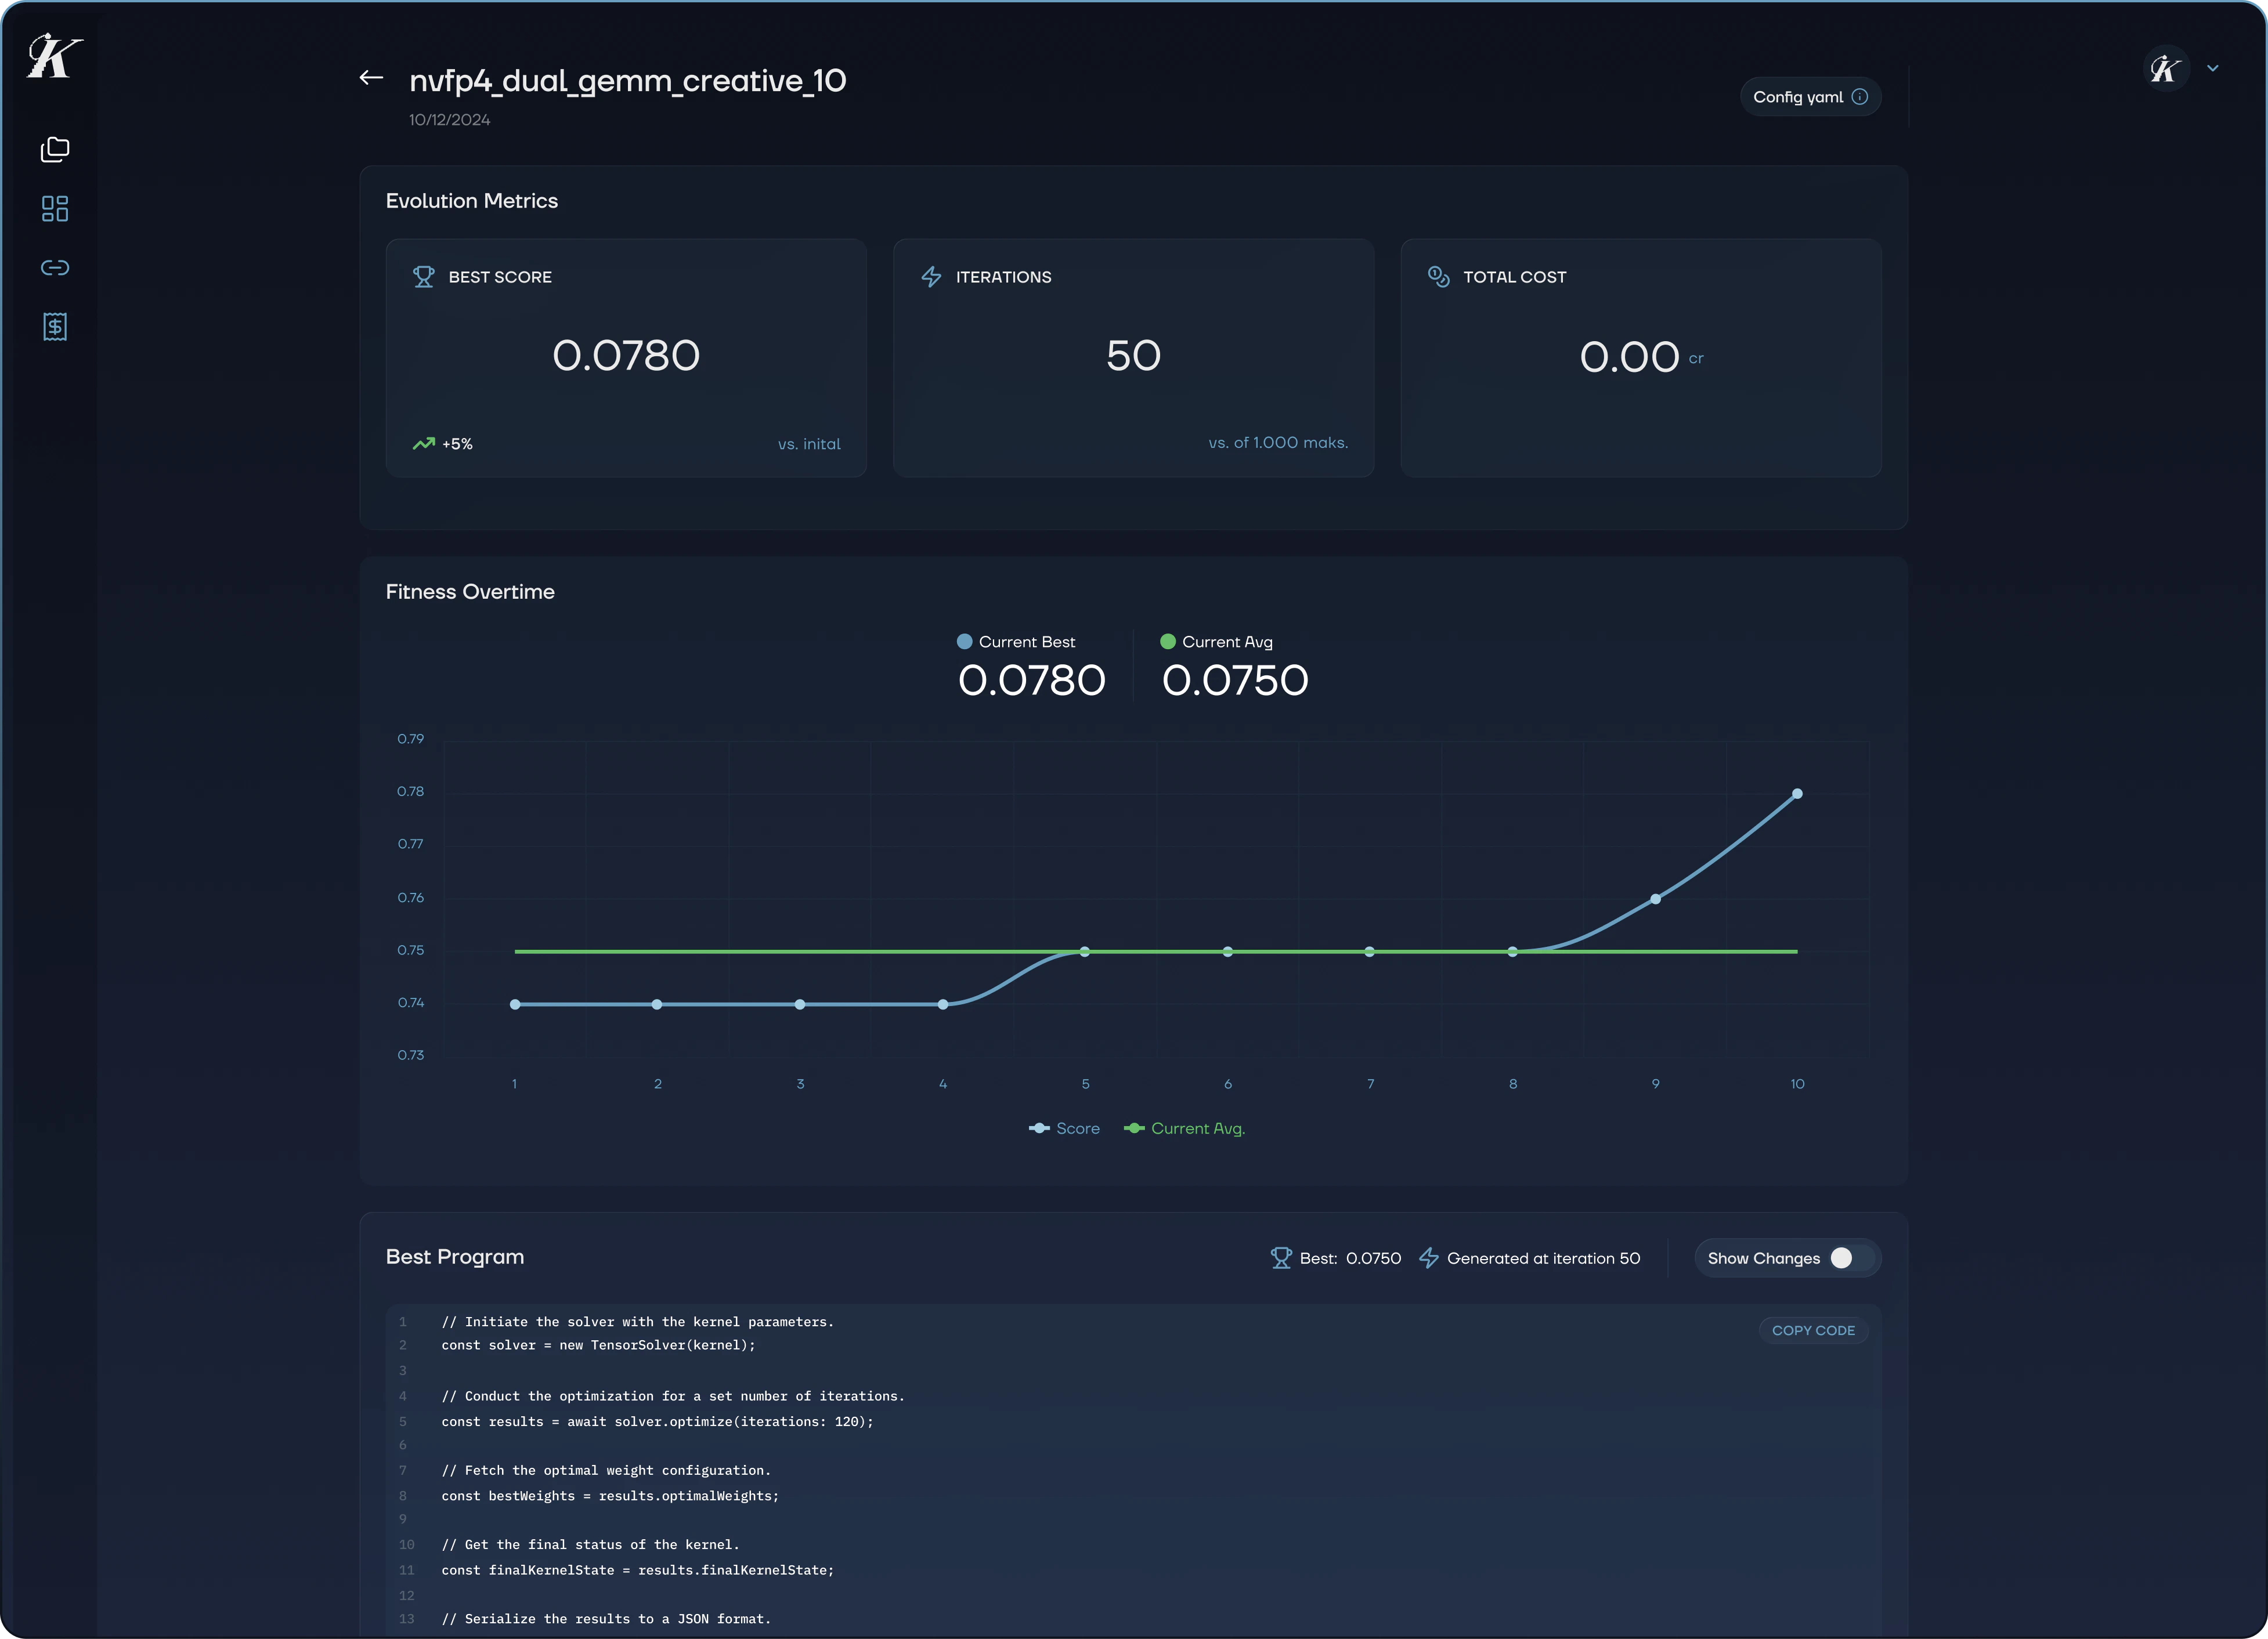
Evolution Metrics
Three key numbers at the top of the page:
- Best Score: The highest fitness score achieved across all iterations
- Iterations: How many evolution cycles completed (out of the configured maximum)
- Total Cost: Credits used for this evolution run
Fitness Over Time
A line chart showing how the evolution progressed:
- Score (blue line): The best score at each iteration
- Current Average (green line): The average score across the current population
A healthy evolution shows the score line climbing steeply at first, then leveling off as it converges on an optimal solution. If the score plateaus early, consider increasing the iteration count or adjusting the temperature for more exploration.
Best Program
The top-performing evolved code, displayed with syntax highlighting. Use the Show Changes toggle to see a diff view highlighting exactly what Evolve changed compared to the original. You can copy the code directly to apply it to your repository.
A horizontal bar chart showing how many iterations each LLM model contributed. This helps you understand which models were most productive for your specific optimization task, useful for tuning model weights on future runs.
Evolution Distribution
A scatter chart showing all generated programs plotted by combined score versus iteration number. Each population group is shown separately. Bubble sizes indicate the best and elite programs, helping you visualize the exploration landscape and see where breakthroughs occurred.
Configuration Summary
A reference of the configuration used for this run: models and their weights, system prompt, status, mode, max iterations, and total tokens used.
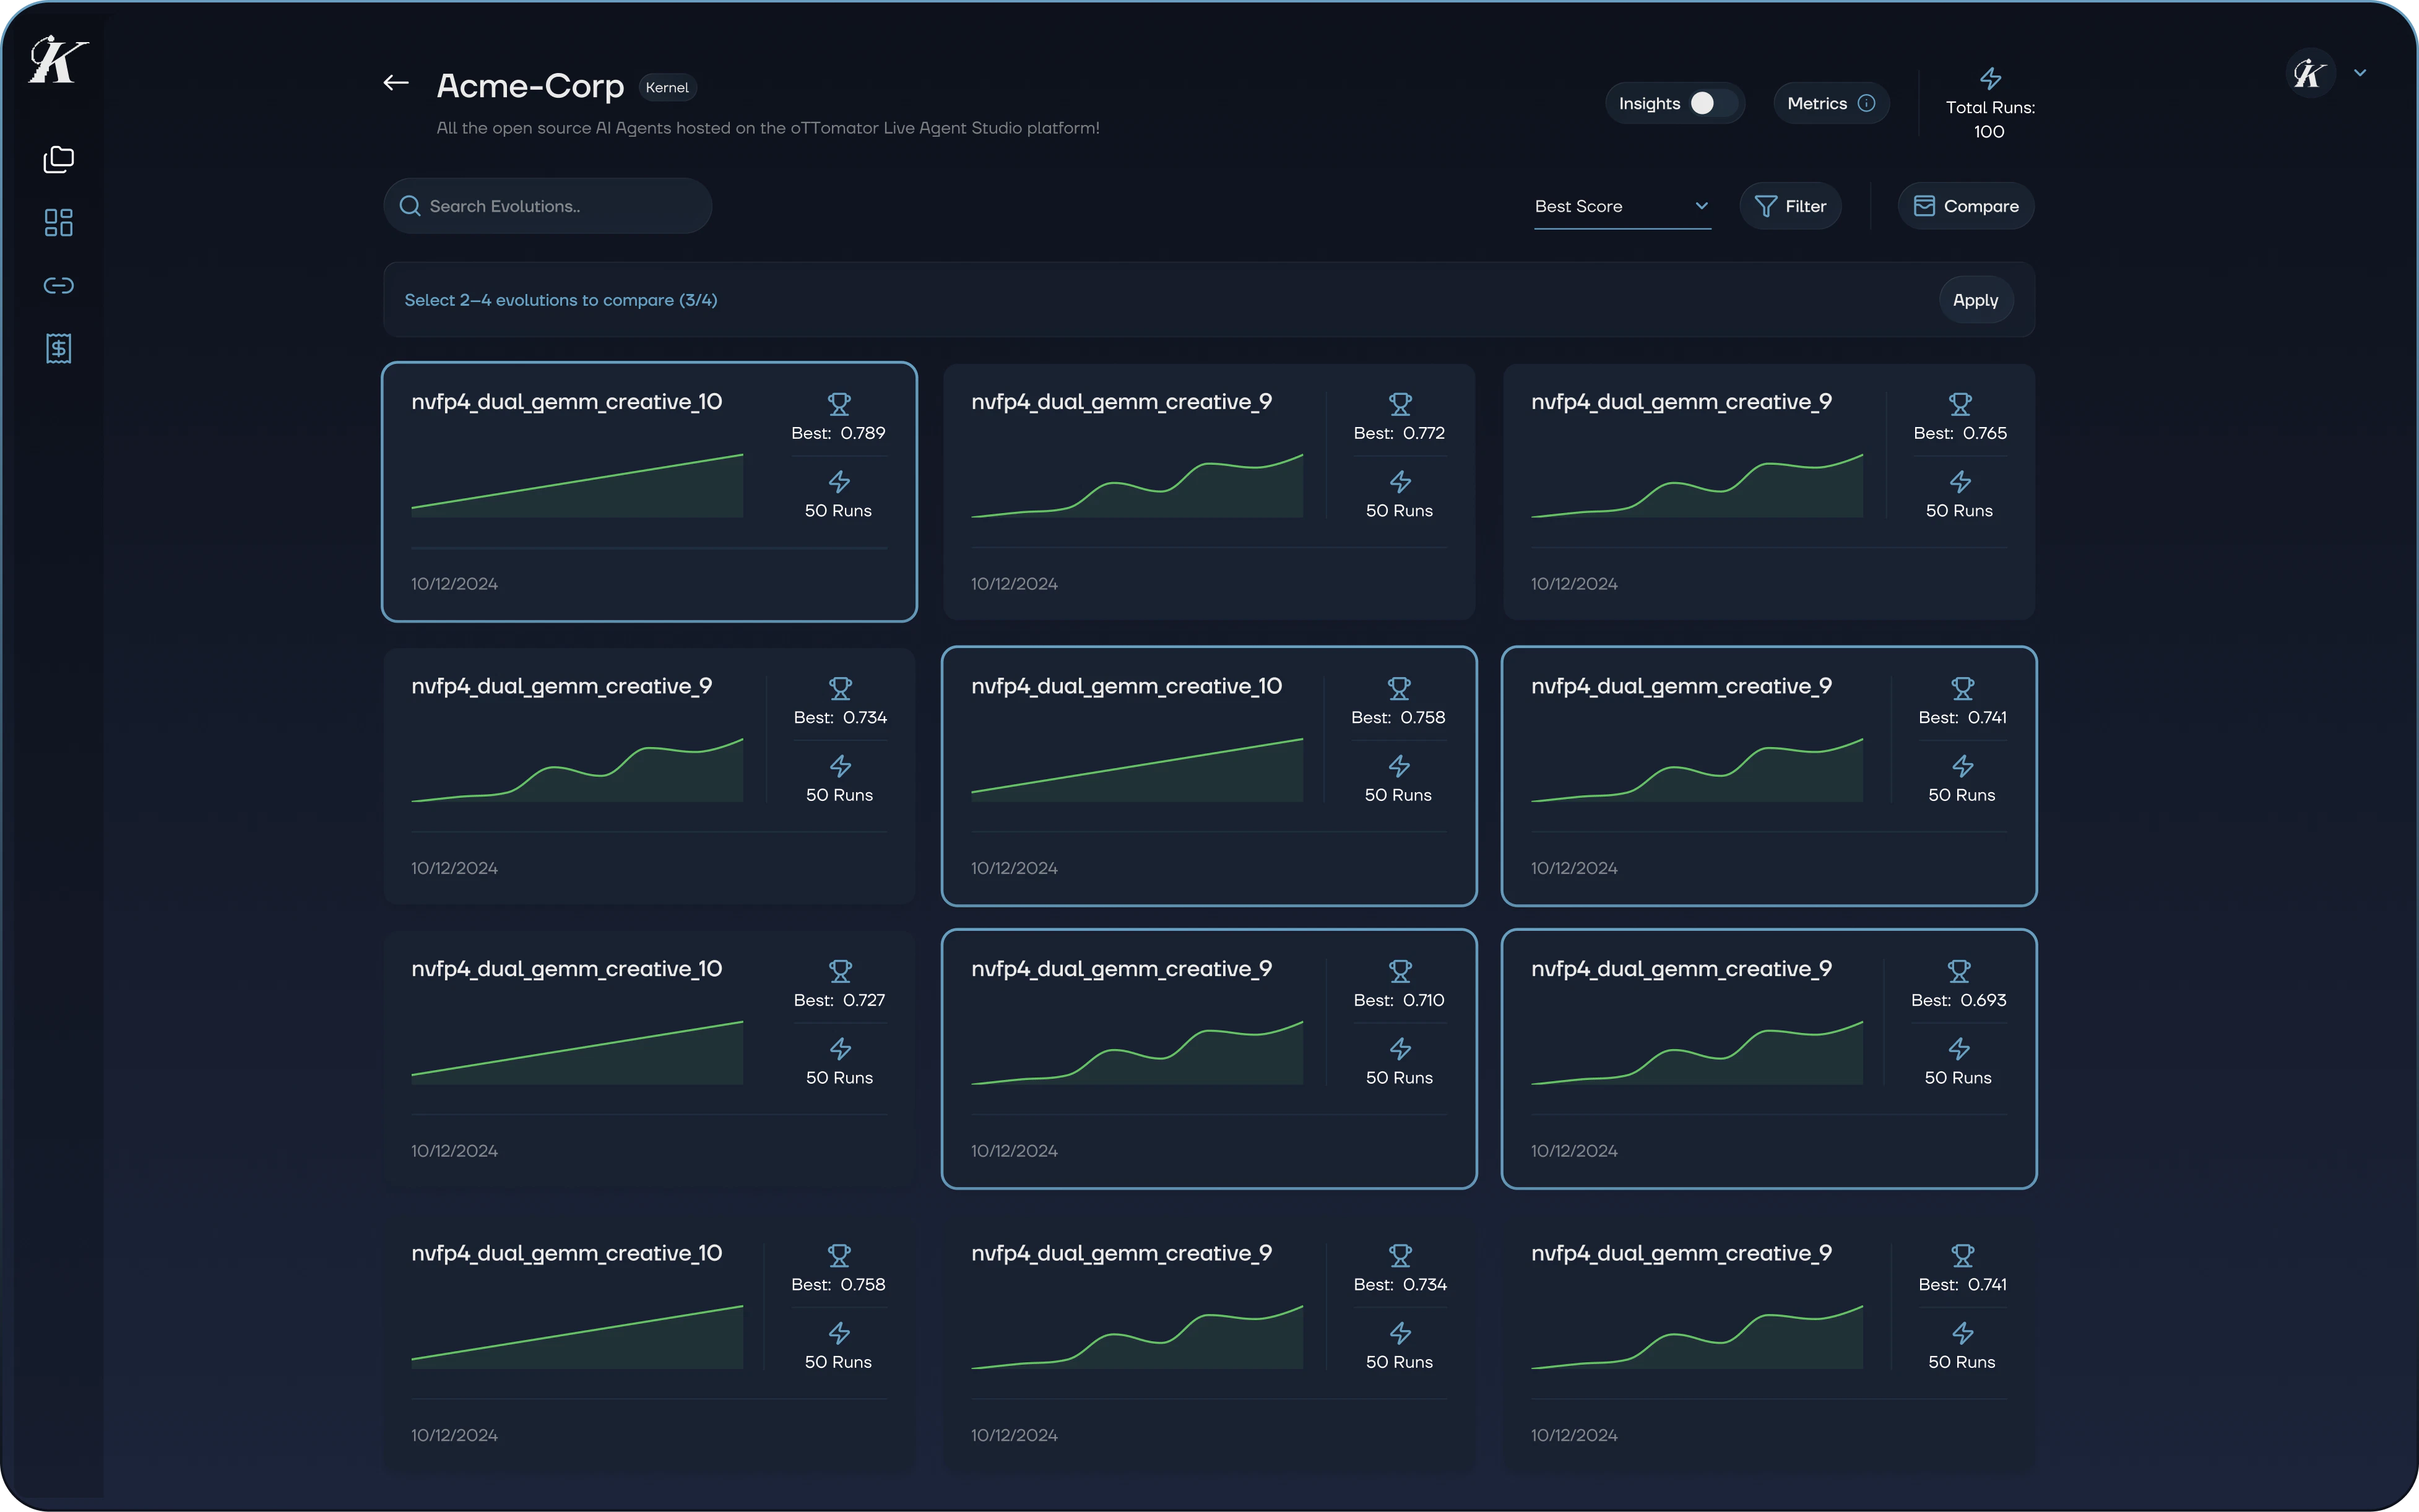
Comparing Evolutions
From the repository detail page, you can compare multiple evolutions side by side.
- Click the Compare button
- Select 2 to 4 evolutions from the grid
- Click Apply to open the comparison view
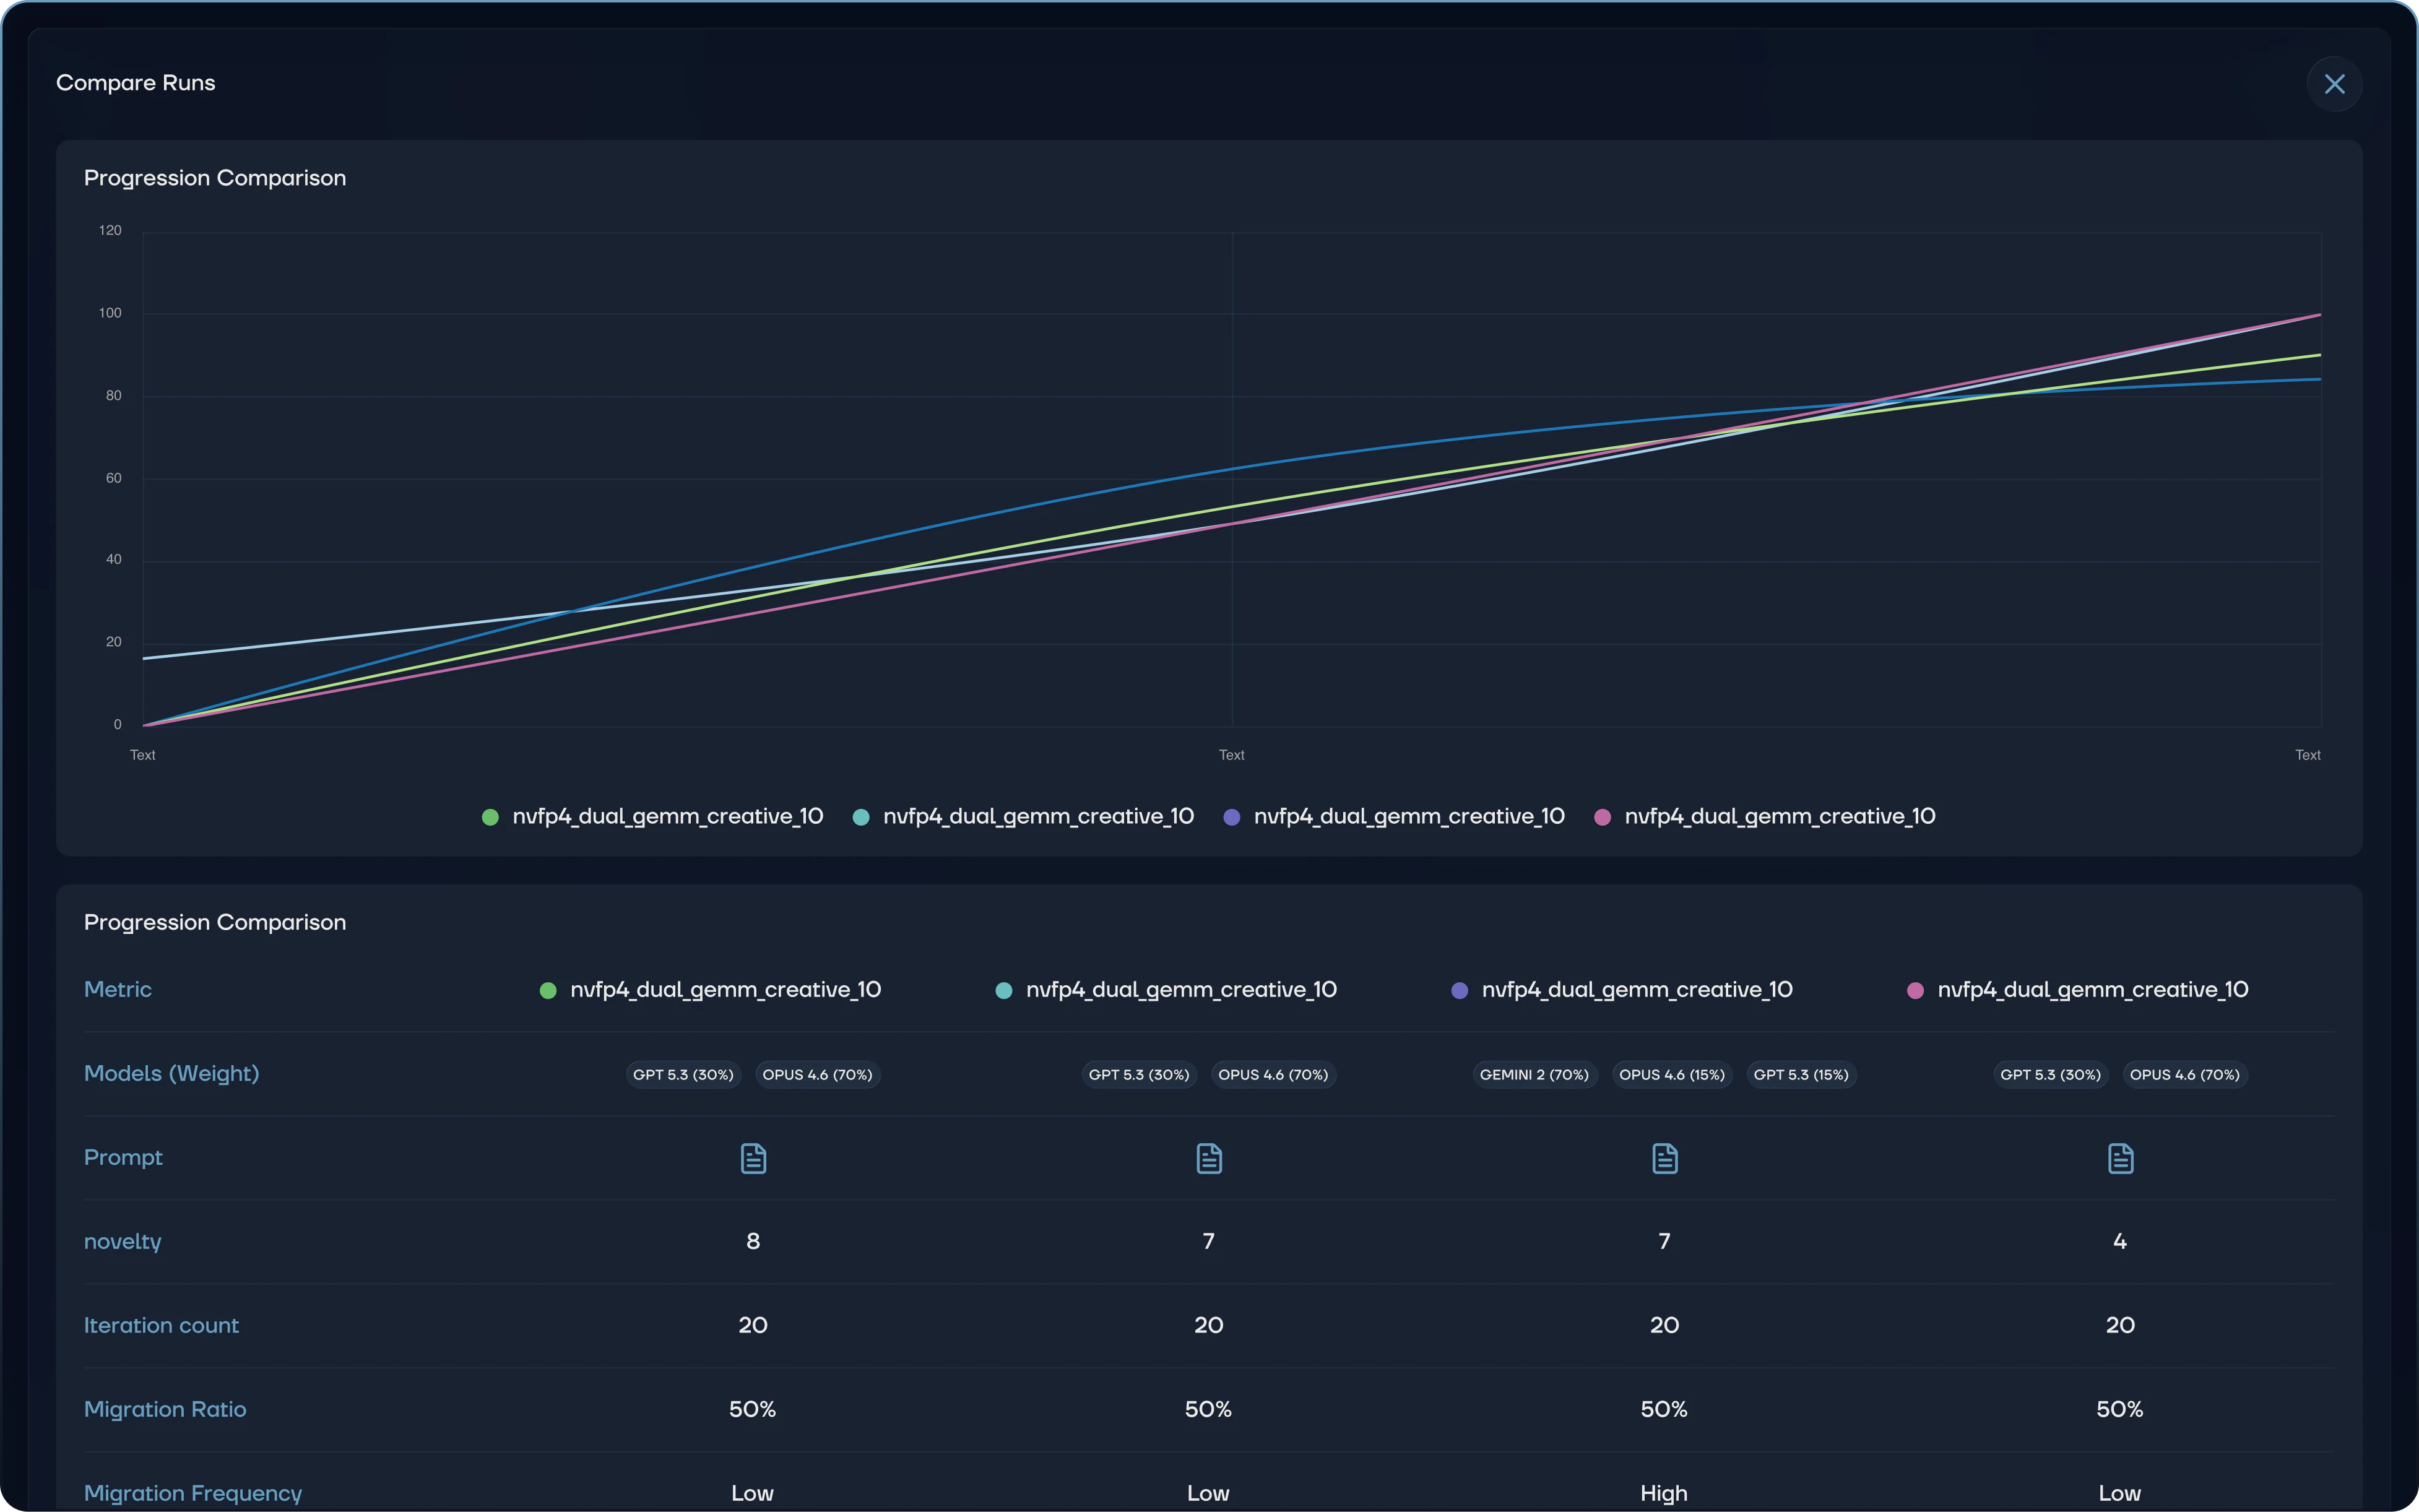
The comparison view shows:
- Progression chart: Fitness curves overlaid for each evolution, showing how they improved over time
- Configuration table: Side-by-side comparison of models (with weights), novelty scores, iteration counts, migration ratios, and migration frequency
This is valuable for understanding which configurations produce the best results for your specific code. Try varying the model mix, iteration count, or prompt strategy and compare the outcomes.
Filtering and Sorting
The repository detail page provides several ways to find specific evolutions:
- Search by name or scope path
- Sort by best score, worst score, most runs, least runs, newest, or oldest
- Filter by date range, minimum iteration count, or above-average results only
Applying Results
Once you’ve identified the best program:
- Open the evolution detail page
- Review the Best Program with the Show Changes toggle
- Copy the code and apply it to your repository
- Run your existing tests to verify the changes in your environment
Iterate. The first evolution often reveals what works. Use the comparison view to understand which configurations produced the best gains, then fine-tune your next run accordingly.
Next Steps