
Analytics & Reporting
Track your security posture over time with comprehensive analytics. Understand trends, measure team performance, and demonstrate security progress to stakeholders.Repository Analytics
View detailed metrics for each repository in your workspace.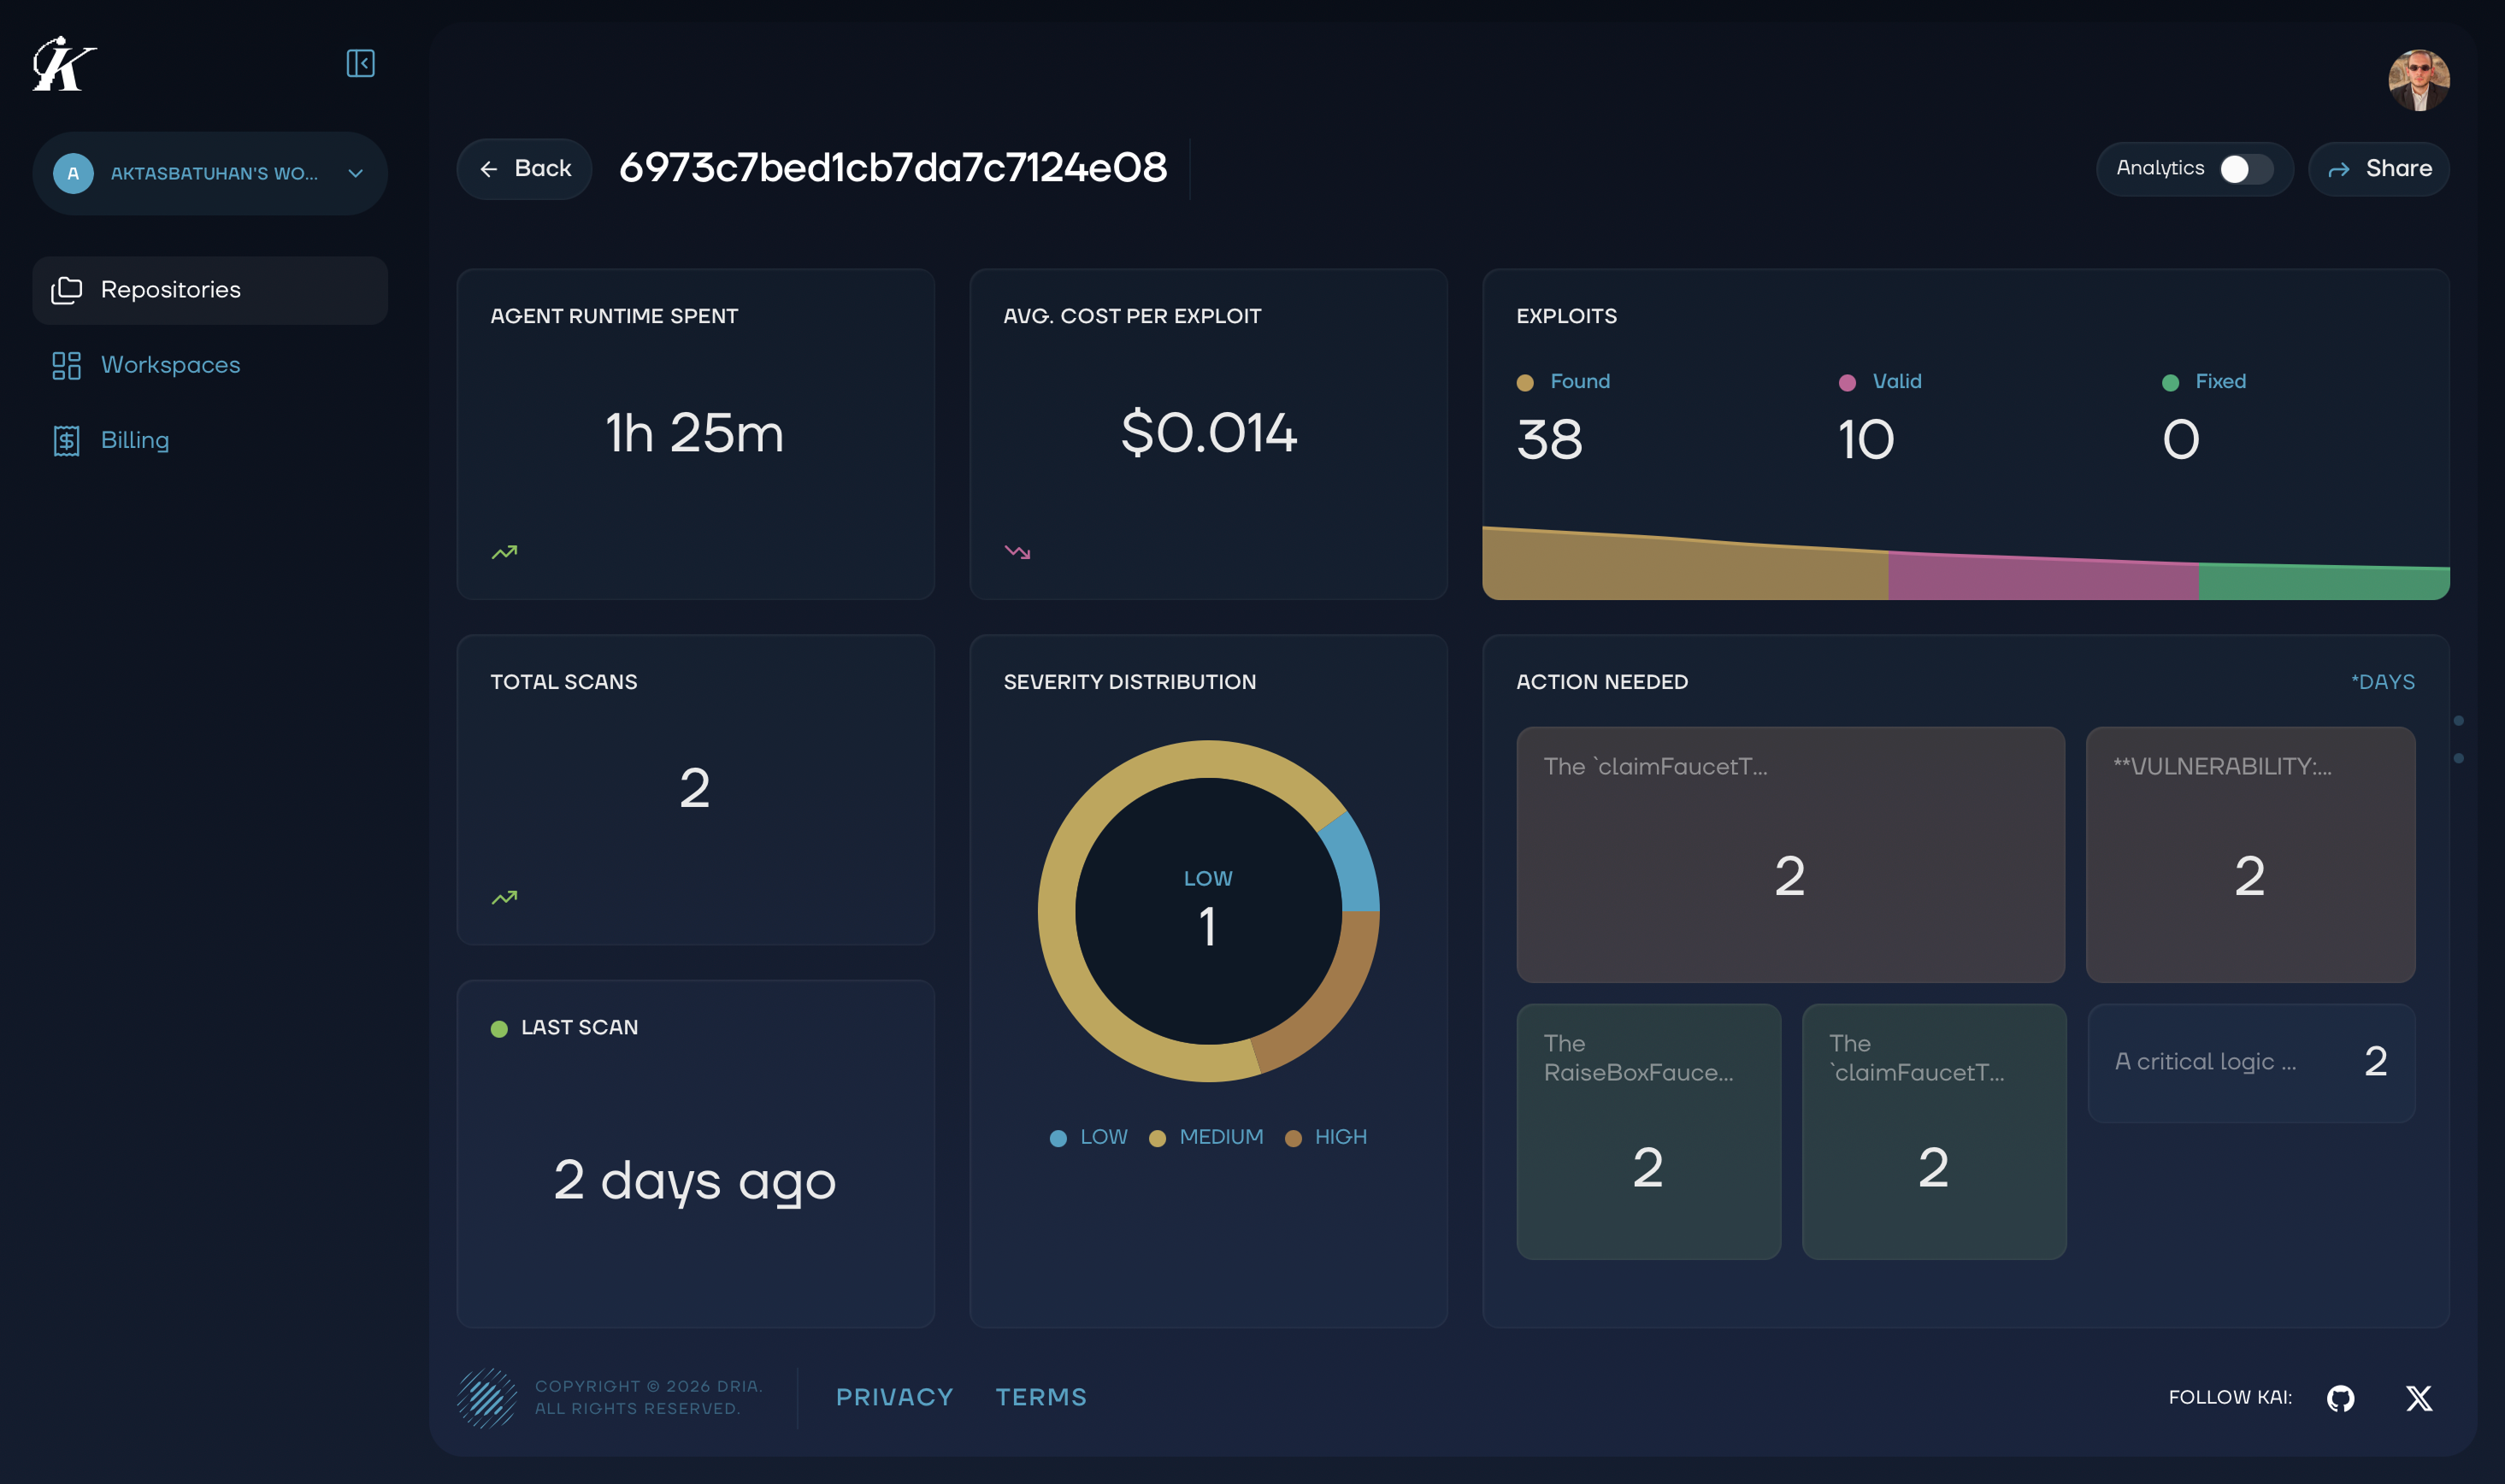
Key Metrics
Vulnerability Counts- Total vulnerabilities discovered
- Breakdown by severity (Critical, High, Medium, Low)
- Verified vs unverified findings
- Vulnerabilities fixed over time
- Average time to resolution
- Current backlog by severity
- Number of scans completed
- Scan modes used (Baseline, Enhanced, Full)
- Trends in findings per scan
Switching Views
Easily toggle between the Kanban board and analytics view to get different perspectives on your security data.Understanding the Charts
Vulnerability Trend
Shows how your total vulnerability count changes over time:- Rising line: New vulnerabilities being discovered
- Falling line: Vulnerabilities being resolved
- Stable line: Balanced discovery and resolution
Severity Distribution
Pie chart showing the breakdown of vulnerabilities by severity:- Red: Critical
- Orange: High
- Yellow: Medium
- Green: Low
Resolution Rate
Track how quickly your team resolves vulnerabilities:- Mean Time to Resolution (MTTR): Average days from discovery to fixed
- Resolution by Severity: Are critical issues fixed faster?
- Team Performance: Who’s resolving the most issues?
Project Health Score
Kai calculates an overall security health score based on:- Number of open Critical/High vulnerabilities
- Age of oldest unresolved findings
- Resolution velocity trends
- Coverage of scanned code
- 90-100: Excellent security posture
- 70-89: Good, but room for improvement
- 50-69: Needs attention
- Below 50: Requires immediate action
Reporting
Executive Summary
Generate high-level reports for stakeholders:- Overall security posture
- Key metrics and trends
- Critical issues requiring attention
- Team accomplishments
Compliance Reports
Document security activities for compliance requirements:- Complete scan history
- Vulnerability discovery and resolution timeline
- Evidence of security reviews
- Audit trail of all actions
Custom Reports
Filter and export data for specific needs:- Date range selection
- Repository filtering
- Severity filtering
- Export to CSV, JSON, or PDF
Using Analytics Effectively
Weekly Review
Check these metrics weekly:- New vulnerabilities this week
- Vulnerabilities resolved this week
- Oldest open critical issues
- Team workload distribution
Monthly Reporting
Create monthly summaries showing:- Overall trend (improving, stable, declining)
- Top vulnerability categories
- Resolution rate improvements
- Recommendations for next month
Quarterly Planning
Use analytics to inform security planning:- Identify recurring vulnerability patterns
- Assess training needs based on common issues
- Plan capacity for remediation work
- Set improvement targets
Next Steps
- Vulnerability Management - Take action on findings
- Team Collaboration - Coordinate with your team